Cardiovascular disease (CVD) continues to be one of the leading causes of death and disease in the UK. It is the leading cause of death in men, second leading cause in women, and around 7.4m of the population currently live with CVD.
The NHS has long identified CVD as a priority. It is one of the main disease groups where primary preventative measures can make a difference. And great progress has been made: over recent decades mortality rates have fallen, as public health and healthcare measures have made inroads into the problem.
But two concerning factors have now come to attention:
- Since 2010, improvements have slowed; and
- More recently, the gap between richer and poorer groups has widened.
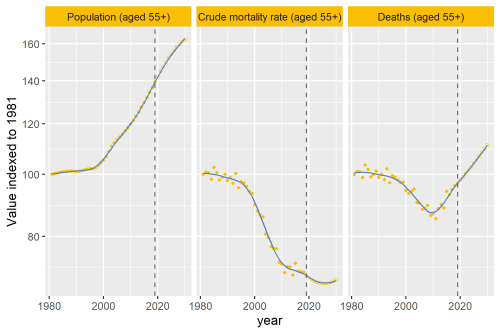
The Figure below illustrates the first point. It presents the time-series of change in under 75 mortality rate from CVD considered preventable across England. It shows that while mortality for has consistently fallen since 2001 for both men and women, the rate of decline has been steadily slowing.

These trends have begun to affect life expectancy. A recent workshop from the OECD and The King’s Fund addressed the growing evidence on this topic. The resulting paper detailed this evidence, also highlighting the negative consequences for healthcare budgets: if the slowdown in improvements of CVD mortality are not addressed, this would add an additional cost of around £47bn to healthcare services and provision in the UK for the 2020-2029 period.
Other research, such as the Global Burden of Disease study, has supported this view. The study classifies 84% of CVD Disability Adjusted Life-Years (DALYs) as attributable to known risk factors. Despite a reduction in the prevalence of smoking, this study notes that trends in other well-known CVD risk factors - like obesity and diabetes- have been slowly rising, along with the growth of factors such as air pollution and substance abuse.
The OECD / Kings Fund workshop also identified the large impact that socio-economic inequalities plays. CVD mortality varies radically by deprivation.
Dividing areas into deprivation deciles, using the Indices of Multiple Deprivation (IMD), shows that the most deprived decile has around twice the mortality rate compared to that of the least deprived. This can be seen in the Figure below:

Relatively, these inequalities have worsened in the past two decades: from around 1.9x in 2001-2003, to almost 2.2x in 2015-2017, despite absolute differences shrinking. This is shown in the Figure below:

It is possible to draw very different conclusions from this evidence.
In the face of a significant cause of death and disease, an optimist will see that something can be done. Recent history shows that focused effort, guided by a desire to reduce inequalities, can achieve results. And we know what to do.
Pessimists would have to concede this point. But they could also conclude that, even equipped with increased knowledge, we have stopped making progress and that the gap between rich and poor has widened.
The most recent evidence tips the balance in favour of pessimism, but history on this topic shows that the results we get follow choices we make. So what will we do – as a society and as an NHS – to make choices that reduce needless inequality?