GP practice consultations are, by some distance, the most common interaction between the NHS and the population it serves. During these consultations, patient’s acute conditions are diagnosed and treated, their long-term conditions are managed, preventative interventions are delivered, and referrals to secondary care are made. Patient satisfaction with access to GP practice consultations is a long-standing problem, but this issue has become more acute since the COVID-19 pandemic. Most consultation appointments are booked by telephone, but in a recent survey, 50% of patients reported difficulties getting through to their GP practice by telephone, up from 30% in 2018.
One might expect that the NHS would have a detailed and comprehensive understanding of the levels, types, and distribution of this important service. Whilst there have been many advances in recent years, there remain important gaps in our knowledge. In this paper we explore the long-term trends in GP practice consultation rates. We use two research databases, Clinical Practice Research Datalink (CPRD) Gold and Aurum, to estimate consultation rates between 1995 and 2022. We consider all interactions between a patient and a healthcare professional: face-to-face consultations in the GP practice, consultations conducted by telephone, or using digital technologies, and visits made to the patient. We set our results alongside (1) estimates from other studies, (2) new data on GP appointment rates, (3) GP patient survey results, (4) information about the GP practice workforce and its workload, and (5) data on other important forms of GP Practice activity.
Key findings
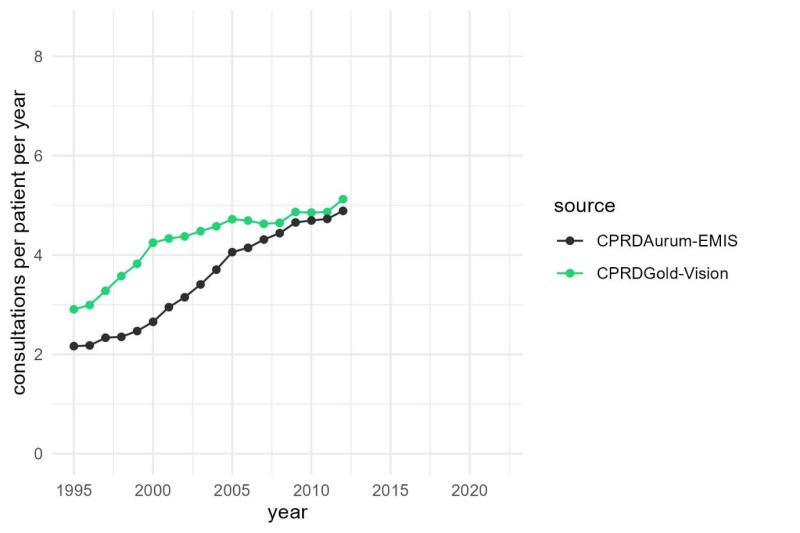
Practice consultation rates, the average number of consultations per patient per year, increased steadily and for many years until 2012, corroborating results from earlier studies.
Between 2012 and 2019, consultation rates fell, reversing the gains seen since 2008. As far as we are aware, this is the first study that highlights a fall in GP practice service levels over this period.
From 2020, the two sources of data that we used to estimate consultation rates, produce substantially different results, with one showing continued reductions and the other showing rapid increases in consultation rates. Analysis of other sources of information fails to resolve the matter. Experimental data from NHS Digital suggests GP practice appointments have increased, but responses to the GP Patient Survey, and data on prescription and referral rates imply that consultation rates have decreased.
That no clear consensus emerges from these analyses of post-pandemic trends, may indicate an issue with the primary unit of activity of GP practices, a patient consultation. For many years, this unit of activity had a clear and consistent meaning. Between 2008 and 2019, counts of consultations from different systems and sources provide similar results and similar trends. But the widespread adoption of remote consultations and digital technologies, the emergence of Primary Care Networks, and the rapid expansion of the allied healthcare professional workforce, have led to radical changes in service models. Future analyses of activity trends and equity of access may require the development of new activity units that better reflect the operations of modern general practice.
This analysis, the first in a series of three, considers changes in the rate of consultations per patient per year. The remaining papers in the series will explore how rates of consultations have changed relative to patient need, the consequences of these changes on hospital activity, and changes in the productivity and continuity of GP practice service provision.
Please have a listen to our podcast below:
CC BY-NC-ND 4.0

This work is licensed under a Creative Commons Attribution-NonCommercial-NoDerivatives 4.0 International License.


